Our main monthly report for April has been out for about two weeks, but there have been many questions arising from the complete disconnect of the stock markets from the rest of the current economic realities. Eventually, the money that is being literally thrown into collapsing assets will dry up, and all of the realities will be pointing in the same direction.
The items which we look at are the fundamentals at the heart of the nation’s economy, and the economies of the world. At the very base level, an economy, as measured by Gross Domestic Product, is described by a very simple equation:
GDP = {Money Supply} X {Velocity of Money} or, conversely:
Velocity of Money = GDP / {Money Supply}
In the USA, the M2 money supply is used, and the Velocity of Money is described as how many “turns per year” this Money Supply goes through, as it circulates via economic activity.
Now let’s look at an extreme case:
If there is no economic activity at all, money has zero velocity. So no matter how large the money supply is, GDP is nothing if money isn’t being spent. The government and banks can pour in all the money they want into the money supply, but if it isn’t moving, GDP still goes to nothing. Now in reality, it simply WON’T go down to nothing, but it WILL contract.
Here’s why…
In our current situation, which has recently been dominated by the effects of COVID19 and attempts to limit its human damages, personal spending has slowed for a number of reasons: stay-at-home, loss of employment, and many avenues for spending being reduced to just essentials. So clearly, the velocity of money has had the brakes slammed on it. Personal discretionary spending rates will be down by 25%-50%. Spending on essentials will decline significantly as well. The $2.2T stimulus package will simply help to prop up some spending within the economy, but it cannot propel that distribution with enough impetus to hold up the velocity of money required to keep a positive GDP growth. Negative GDP growth is inevitable.
In the Great Recession, the US GDP contracted in total by a mere 2.5%.
Yet, that brought the nation’s economy to its knees. As a consequence of COVID and responses to it, the mildest projection of GDP contraction we’ve seen so far is -4%. We think it could be down more, perhaps 5%-8%. So it is again, a virtual guarantee of a hard recession, and we’re about six weeks or so into the 26-week period required to get a confirmed recession declaration by Federal Reserve economists.
The underlying metrics of the economy are deeply down:
- Employment is down significantly, with tens of millions newly added to jobless roles
- Metal commodities consumption and prices are down significantly (as much as -30%)
- Oil prices have eroded from just north of $60/bbl, to $20, and now today to nearly $0!
- Interest-bearing instruments are paying virtually nothing, providing no spendable cash
- Despite recent short-term action, equities markets are still down more than 15% from February highs, reducing feelings of financial well-being and security, creating a negative “wealth effect”
With all this in mind, and armed with over 48 years of data and patterns developed over the last six recessions, AP has begun to create some projections regarding the eventual levels that will be reached in the equities markets, and that is represented simply within this chart, an excerpt of one of our internal tools used to measure “heat” and “risk” for the S&P500, compared to its own historical norms, and now, also compared to GDP itself.
Here is that chart – where the bright green solid line is the monthly closing price for the S&P500, and the dashed green line represents a relative GDP “value” for comparison.
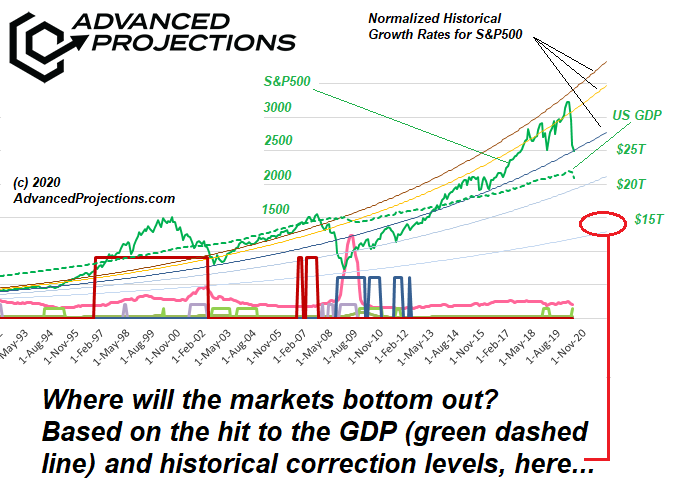
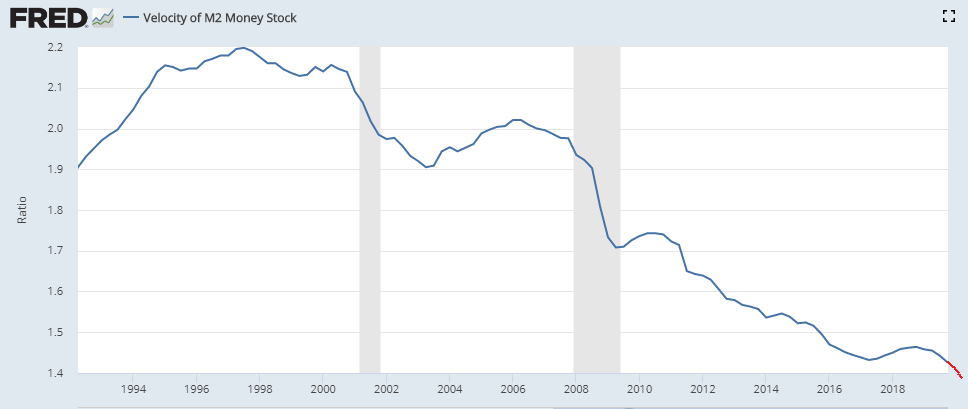
The smooth thin-line curves represent various normalized growth rates to which the actual S&P500 can be compared. The S&P has just “returned to the mean” so far, without taking into account ANY actual negative hits to the GDP. The consequences of a relatively small negative hit to the GDP during the Great Recession has had long-lasting consequences, in terms of a lowering of GDP growth rate, and a huge reduction in the Velocity of the M2 money supply, as shown in this chart from the Federal Reserve for the same time period as our equity chart above, to which we have added a red projection line:
The conclusion is simple. Equities are in for a very rough road downhill for many months yet to come. Thoughts about the COVID Recession and the topics addressed in this article?
Let us know in the comments below!


Thank you
I wonder if someone could be kind enough to answer the following question. Is the FED’s new found obscure way of buying corporate bonds included in your current analysis, if not, how does this impact your current projections of the S&P 500 falling around 1500? I would gladly appreciate your thoughts on the matter, thank you.
David, thanks for your question. This is an important element
in the hopes that are being expressed in the retail investment
community. However, this brief explanation might clarify what
is really going to happen. Reviewing what we said above…
Any economy, including our own, can be calculated by a pretty
simple equation, remarkably like the equation for momentum in
physics.
Momentum = Mass x Velocity
Similarly, in economics:
GDP = {Money Supply} x {Velocity of Money}
Here is the relevant portion of what the Federal Reserve says
about the Velocity of Money:
“The velocity of money is the frequency at which one unit of currency
is used to purchase domestically- produced goods and services within
a given time period. In other words, it is the number of times one dollar
is spent to buy goods and services per unit of time. If the velocity of
money is increasing, then more transactions are occurring between
individuals in an economy. The frequency of currency exchange can
be used to determine the velocity of a given component of the money
supply, providing some insight into whether consumers and businesses
are saving or spending their money.”
As you can see from the chart we showed above, the Velocity of Money has
been slowing down for some time, and just prior to the COVID crash, was
already at historic lows. We can pretty much guarantee that due to the
economy more or less being shut down for several months, that this velocity
figure is crashing as well – because people cannot spend money freely, in
most of the ways they were just a few months prior.
So you ask about the Fed buying corporate debt. This certainly adds to the
money supply, but does it add anything to the velocity of money? Does the
increase in the money supply make up for the huge losses in velocity?
Corporations may be issuing new debt, which the Fed can buy, but the current
Fed actions are designed to prevent the collapse of corporate bonds, to
prevent them from becoming toxic assets, similar to the many $T of mortgage-backed
securities ahead of the Great Recession. They are trying to keep the economy
from being poisoned by a glut of worthless corporate bonds.
If they continue to buy new corporate debt, then we ask what the borrowers would
do with the cash? We submit that they will use it for survival mode existence.
Keeping the lights on, maintaining skeletal staffing, paying off accounts payable
that simply cannot be delayed beyond 120-180 days aging, etc. This money
simply will not add to the Velocity of Money in any truly significant way.
Our view is that in order to quickly add to both the money supply AND the velocity
of money, that fresh funds in significant amounts must be injected into the bottom
layers of the economy. This can be done in two ways, either through direct payments
to consumers, in amounts well beyond survival needs, and/or through Federal jobs
programs, which may create many temporary new Federal employees, or payments
to businesses which bid for Federal contracts on “shovel-ready” projects.
The former approach, direct payments, is FAST – it can stimulate significant demand
and spending rapidly, within 3-6 months. The latter approach is slow, and would only
gradually take hold as projects spin up and hire employees, so stimulation takes a
slower, more gradually rising path of the course of 1-5 years.
As this recession progresses deeper, we think that eventually, the government will
be forced by necessity to make large direct payments to consumers, much larger than
what has been made so far. If you look at 250M people (taxpayers plus their children)
each getting an average of $1000 ($1200 per adult, $500 per child), this amounts to
only $250B out of $2.2T in the original stimulus. Where has the rest of this money gone?
Has any of it provided a kick to the velocity of money? We say that there is no evidence
for it.
The Federal Reserve has already announced a GDP contraction for the 1Q2020, based
upon statistics and events thru the end of March. Here are the last three annual GDP
“rates” as published by the Federal Reserve (in $T)
Q1 2020: 21,537.940
Q4 2019: 21,729.124
Q3 2019: 21,542.540
You see the contraction from a few weeks of economic slowing in the 1Q has pushed the
whole economy backwards by more than six months. GDP for 2Q2020 is going to be pretty
horrible, and it is likely the Q2 number will be below $20T, pushing us back two years, and
each subsequent quarter, for quite a while, will still show contractions.
Does this help in understanding what we are trying to say?