
This article, written by Rich Vesel – Founder of Advanced Projections, was originally written for and published by Advisor Perspectives, linked here.
We are all familiar with the Consumer Price Index (CPI) as a measure of inflation and price stability, which the Fed targets at a 2% annual rate.
When this statistic is volatile, the Fed refers to measures of core inflation to mask off the more volatile components from food and energy. This, it claims, is found within the Personal Consumer Expenditure (PCE) figures, with food and energy components removed.
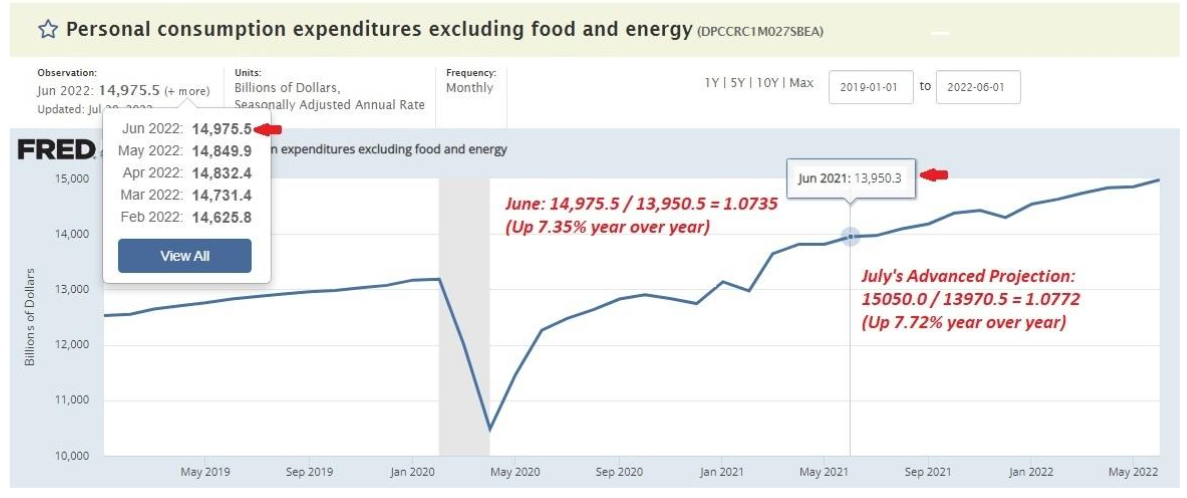
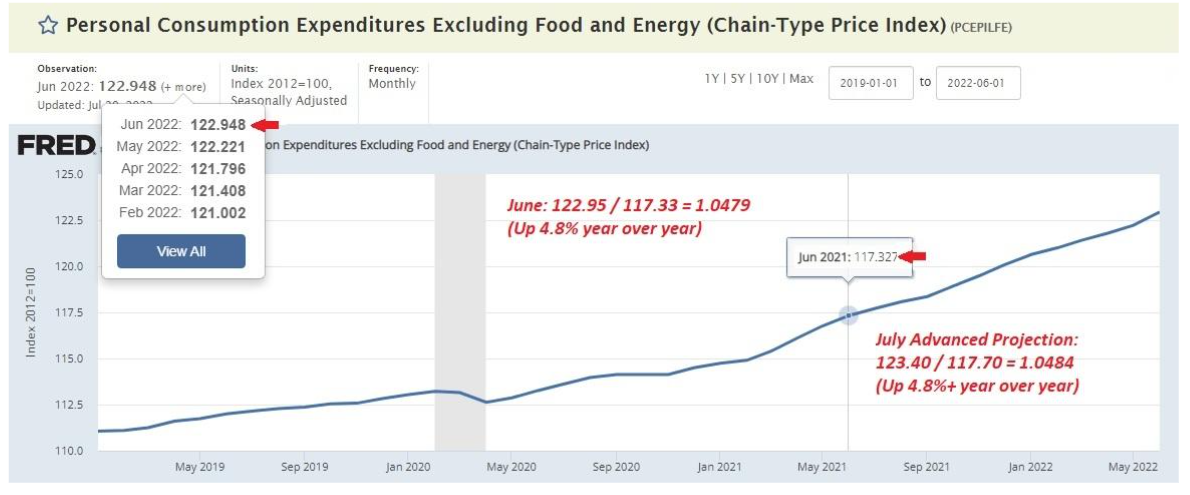
There are two indices that are used to measure inflation numbers. One uses raw data, and generates an absolute total, currently running just under $15 trillion annually for the nation. The other is a “chained” index, which is compared to a base value of 100 established in 2012. This chained index is running above 122.
Here is where the Federal Reserve data can be found:
- Raw: https://fred.stlouisfed.org/series/DPCCRC1M027SBEA
- Index: https://fred.stlouisfed.org/series/PCEPILFE
These two charts are reproduced below, with my notations in red. They show what these Fed favorites are likely to show when the July 2022 data comes out over the next couple of weeks, using nominal projected values for each of these statistics.
See More from Advisor Perspectives:
https://www.advisorperspectives.com/articles/2022/07/16/why-inflation-will-not-go-quietly-into-the-night
https://twitter.com/AdvPerspectives
https://www.linkedin.com/company/advisor-perspectives