NOTE:
Remember that in dealing with ANY economic statistics, the TRENDS are more important than any single reading. Up and down “noisy” movements in these statistics must be monitored and filtered to identify the underlying trends. Also, when we assign a probability for recession, it is like a weather forecast for precipitation. Conditions warrant an assignment of probability, and under such conditions, there is an X% chance that the forecast event will occur, be it rain or recession.
Last month, we said this: “General expectations out just ahead of this August’s CPI announcement were for 3.0% year over year inflation, and it came in at 2.9%, with the Core CPI less food and energy at 3.2%. If the September CPI also comes in below 3%, the Fed might recognize this as an acceptable trend confirmation, allowing them to begin lowering rates. We are not positive about this, as they may want to see at least three months in a row of a CPI below 3% and trending downward before beginning to lower rates.” Now, as the CPI has dropped to 2.5% with unemployment now trending back upwards, the FOMC clearly determined that it was time to begin reducing interest rates. This was not a “token cut” of 25 basis points, but a significant cut of double that amount.
Bureau of Labor Statistics reports: Unemployment declined a bit, to 4.2%, with a new job gains figure for August, adding a tepid 142,000, well below the 168,000 that was expected. Here is the latest BLS summary table:

The currently healthy employment situation still allows the Fed to be as free as they deem necessary in their interest rate policy decisions, and in their plans for unwinding their balance sheet to slowly decrease the money supply. They previously indicated that their rate increases have come to an end, but with three months of inflation that is actually declining over the previous month, and headline CPI at 2.5%, the probability that they will have to raise rates again in this business cycle dropped to just about nil.
If unemployment remains below about 4.5%, the Fed can remain focused on their stable price mandate (inflation), and adjust rates slowly downward in a measured fashion. We expect politicians and economists to start making unpleasant noises if unemployment moves to, or thru, 4.5%, despite the Fed’s stating that that is still a “healthy” employment figure. If unemployment heads north of 4.5%, they will have to divide their attention to address both problems, and that’s where it gets tricky for them. Unemployment trending up and over 4.5% begins to get the attention of the media, politicians, and the working population, at which time all become much more vocal on the topic of employment.

Historically, as illustrated in the above chart from Advisor Perspectives, recessions have come pretty quickly after unemployment levels begin to trend upward, and they end coincidently with fresh employment gains. This time, however, it seems as if the Fed has finally learned from many past lessons, that using a solid data-driven approach to deal with inflation has paid off, with the gap between the unemployment trough and the current time being a full year, without triggering a recession. We credit this with the Fed’s recognition of the lags between their policy moves and their intended effects, and not adjusting policy too quickly when data trends first change.
Without some new major geopolitical disruption that is perceived to be significant, such as expansions of the instabilities in the Middle East and around the Straits of Hormuz, we don’t see crude prices now moving much higher than the ~$85 per barrel peak experienced earlier this year. Any fresh or forecasted demand weakness could just as easily drive prices down again. WTI is currently trading around $70/bbl, and has bounced around that value for about a month. The EIA continues to project a general seasonal decline in motor fuel prices for the next two years, but not before the effects of temporary OPEC production cuts add a bit to the price of gasoline again in the last quarter of this year. WTI has recently traded as low as $67/bbl.
The EIA also expects Henry Hub prices to remain below $3/mcf for all of 2024 and 2025, after those prices bottomed out below $2 just a few months ago. Underground storage reserves are already at the high end of their five-year average range, and Henry Hub prices remain well below $3/mcf, so it continues to be a good time to look at locking in a lower price for home heating gas. We at the end of “reload season” with underground stored gas levels having been replenished for the upcoming winter. With last winter being the warmest on record, there was a surplus remaining in storage, and additions to storage have been running below normal, due to the existing surplus. Those lower replenishment rates have contributed to lower and more stable prices, at the expense of profits at 36 energy exploration companies. We have the expectation for gas to be cheap and plentiful throughout the winter, aside from regional price spikes.

The Fed’s previous “dot plot” projection, released with June’s FOMC report, showed slightly declining rates in 2024 and more so in 2025, but the “consensus” amongst the voting members appeared to evaporate for 2025 and 2026, with a very wide spread amongst the expectations of the members. That dot plot embodied those widely varying expectations, and we continued to have greater faith in the opinions for higher rates for longer than expected. The December ’23 plot was widely misinterpreted by pundits who simply used the “majority view” to draw an erroneous conclusion, neglecting to recognize the fact that the “majority view” has been dead wrong, i.e. too optimistic, throughout ten quarterly issuances of dot plots since December 2021. We were waiting for their 9/2024 and 12/2024 Dot Plots, as we looked for further alignment with our own more realistic outlook for rates.

Above is courtesy of Yahoo Finance, showing the FOMC’s June and September dot plots in comparison, as well as our own projections shown in red. The Fed’s dot plot issued with this September’s FOMC meeting appears to resume an overly optimistic view for the speed of their return to “normalization” of interest rates. Also missing from their longer term projections, which we include in red, is a slight overcorrection to the downside, with longer run rates moving a bit higher again, as a natural consequence of the more rapid descent in rates.

The Fed’s own algorithm, shown in the graphic above, predicts recession probability based on the yield curve inversion we watch, and that rapidly increased in 2022 and early 2023. In November 2022, its initial movement over 40% was a historically accurate red flag for a recession centered about one year after reaching the 40% mark. Our enhanced AP-FD indicator has been red ever since that indicator moved solidly above 40%. We show that trigger level in this most recent chart from the Cleveland Federal Reserve. The 10-year yield had recently moved from around 4.6% back down to 4.36% in the last couple of weeks, as traders again adjust prices to reflect a bit more hope for declining rates, and a bit more pessimism for the economy. After the rate cut by the Fed, the 10-year yield plunged to well below 4%.
With the Fed Funds rate now down to 4.75-5.00%, our AP-YC Yield Curve indicator’s negative spread magnitude continues to remain wide, and it is expected to remain red for many months ahead. This spread maxed out at nearly -1.9% at the end of May 2023, just weeks before the Fed pause. It ended this May at -1.00%, but moved back to -1.32% at the end of August, and is now around -1.00+0.05% during late September.
August’s closing value for the S&P500 was 5648, up 126 points for the month, which is keeping our AP-SI indicator deep in red bubble territory. The more tepid August 142k new jobs figure, along with renewed expectations for a September rate cut, ignited some increased volatility, and a downdraft in late July. After the August inflation figures came out, the focus returned to the likelihood of a September rate cut. We saw that as at least a 50-50 chance of happening in our last month’s report, which also included the potential for a 0.50% cut if jobs and inflation numbers were moving in the directions the Fed needed to see.
Clearly, there is still plenty of cash available to continue driving upward moves in equities. Corporations are doing at least $380B in buybacks in 2024, which we still claim is a huge flood of (poorly spent) corporate capital. Margin borrowing increased significantly in May, up 4.4%, but June was flat with no significant change. July’s reading was up a mere 0.2%, and August actually showed a decline of 1.7%, even as equity prices returned to their highs. A continuation of the divergence in the direction of equity prices and margin debt may indicate unstable topping behavior in equity pricing.

AP Equity EKG:

For March thru July of this year, our equity EKG (above) indicated very high risks due to the extreme overconfidence levels shown over that time, just as new index highs were being set. We warned of an imminent correction on July 25, using the chart above. Below, this month’s Equity EKG shows the spike in volatility and sharp price decline which then ensued, along with a surprisingly rapid recovery by the end of August:

In the long term historical chart shown below, courtesy of Advisor Perspectives, we continue to point out how risky the US equities markets are at this time. The chart shows where the investment risks in the S&P500 went during the past 125 years. The base zone around -50% risk level is where equity valuations have bottomed historically, as recently as 1980. This version of the chart is updated through the end of July, and in August, risk declined slightly to 129%. We expect that September’s new highs in equity will push risks back up, and will continue to be accompanied by our own continuing warning of EXTREME equity overvaluation/risk status, with October’s chart version in our next report.

Moving above 130% risk means another historically risky bubble will likely be ready to burst. Risk right now is forming its second highest peak in 125 years, and is clearly in 3-sigma danger territory. This risk level should return to well below 50% before it even begins to look “statistically safe” to be heavily invested in equities again for the long term (i.e. for those who prefer to “buy low” and hold for decades). The market’s activity just after the most recent inflation report certainly reflected more knee-jerk optimism, but whether that is sustainable (and why it should be) continues to be the ongoing question.
Hussman Strategic Advisors is very clear about how risky markets are, from their own historical perspective, and how safer investing in long-term treasuries has paid off better when markets established historic bubble tops. In our own opinion, we are in such a region again, and we recommend reading John Hussman’s somewhat lengthy article:
https://www.advisorperspectives.com/commentaries/2024/06/24/ring-my-bell-john-hussman

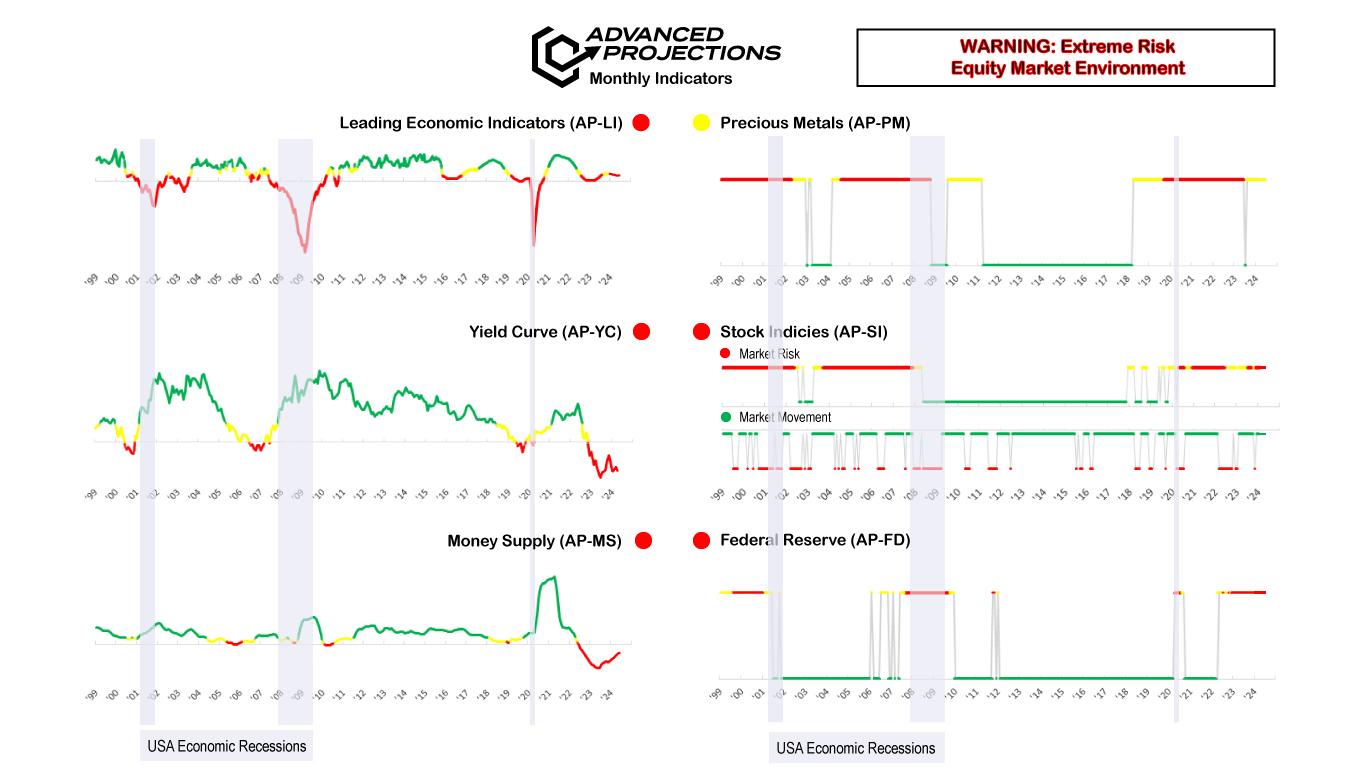
Our AP-LI indicator: This month’s Leading Economic Indicator baskets are again coming out on the negative side. The set that is OECD-sourced and published by the Federal Reserve showed a miniscule decline, and the basket sourced by The Conference Board showed a small decline yet again. We incorporate both the TCB and OECD baskets, and that results in our AP-LI indicator continuing red for September.
Here’s the commentary from TCB in their recently released September LEI report. Note that their current LEI has fallen back to 2016 levels:
The Conference Board Leading Economic Index® (LEI) for the U.S. declined by 0.2% in August 2024 to 100.2 (2016=100), following an unrevised 0.6% decline in July. Over the six-month period between February and August 2024, the LEI fell by 2.3%, a smaller rate of decline than the 2.7% drop over the six-month period between August 2023 and February 2024.
“In August, the US LEI remained on a downward trajectory and posted its sixth consecutive monthly decline,” said Justyna Zabinska-La Monica, Senior Manager, Business Cycle Indicators, at The Conference Board. “The erosion continued to be driven by new orders, which recorded its lowest value since May 2023. A negative interest rate spread, persistently gloomy consumer expectations of future business conditions, and lower stock prices after the early-August financial market tumult also weighed on the Index. Overall, the LEI continued to signal headwinds to economic growth ahead. The Conference Board expects US real GDP growth to lose momentum in the second half of this year as higher prices, elevated interest rates, and mounting debt erode domestic demand. However, in the Fed’s September 2024 Summary of Economic Projections, policymakers suggested 100 basis points of interest rate cuts are likely by the end of this year, which should lower borrowing costs and support stronger economic activity in 2025.”
A couple of other factors are noted here, which we feel are worthy of attention, beyond the small on-trend changes in LEIs:
The AP-MS money supply indicator has been red and will likely remain there for many more months. The Fed has generally been engaged in the process of unwinding their balance sheet, in a painfully slow fashion, but which has the effect of contracting the money supply. The value at the end of 2022 was $21.37T, down 2.6% from the April ’22 peak. The recent Fed numbers from December and January said the M2 ended December at $20.92T, but it then declined by $170B during January. First quarter levels hovered around $20.8T, down 5.2% from its recent peak. A final 2Q reading through June of this year shows a modest increase to $20.95T. Third quarter estimates should be in our October report, and we forecast a level well above $21T by year’s end.
Gold prices ended August up to $2503, having recently moved solidly over $2500 and now above $2600, solidly into all-time high territory. Silver moved down in the month, to $27.90, but has recovered nicely since then, now above $30.50. Rhodium was also up a bit at $4525/oz and is a little higher now. Platinum ended the month down slightly to $925/oz. August’s month-end prices for gold and rhodium keep our AP-PM indicator at yellow at this time. This indicator is unlikely to change state for the time being, until either rhodium deteriorates significantly, or gold prices continue exploding upwards.
We remain in a “classic” business-cycle period, during which our standard six indicators should reliably indicate an incipient recession. In addition to the indicators, we are able to generally infer in real time what the implications are for recent Fed policy moves, as well as make some informed predictions of what they will do next. We emphasize here that they won’t respond to any equity market tantrums, as long as there is no accompanying corporate debt crisis. It is advisable to respect the Fed’s commitment to resetting inflation back to 2%, which is clearly a multi-year process which they have just declared as a job not yet finished.
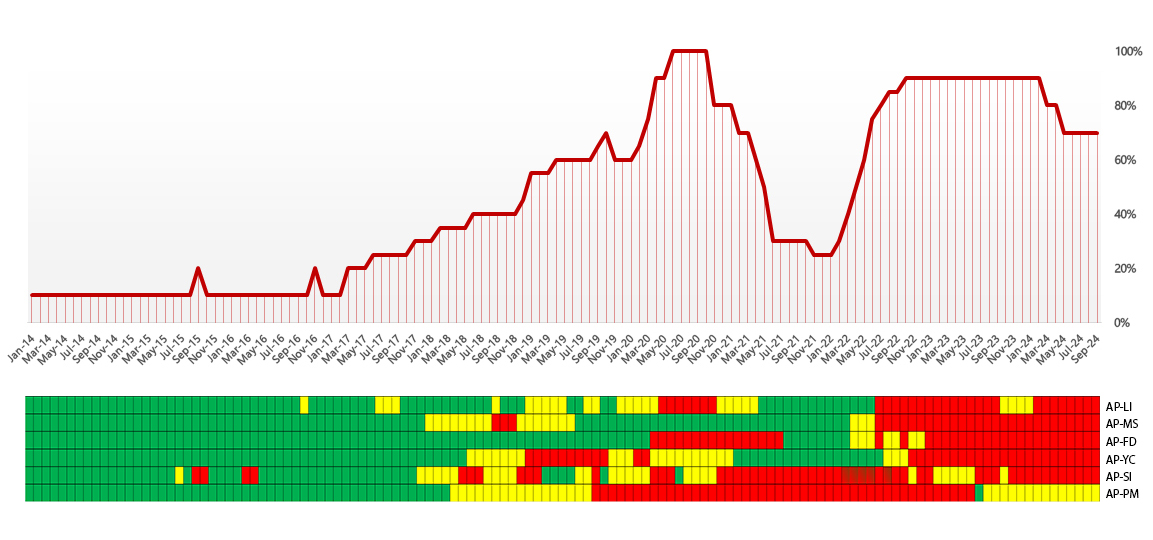
Our recession potential stays at ~70% this month, with expectations of further trend validations over the next months ahead. The Federal Reserve had responded to declining inflation numbers with a year-long rate-hike pause, which has now officially ended with their 0.50% rate cut this month. More recent jobs and inflation DATA now suggests to them that there will be one or two more cuts likely by the end of the year, as confirmed by the Fed’s latest dot plot. The Fed now sees rates continuing above “normal” through 2025, and normalized by mid-2026. We believe they have gone back to being overly optimistic in these expectations.
We continue to maintain that this is an extremely risky equity market environment from a valuation standpoint, with the potential for significant and protracted drops, as well as short-term rallies based on unwarranted optimism from a few misunderstood inflation and Fed rate policy readings taken out of context from the broader economic picture. The continuing high levels of valuation indicators shown in our charts over the past year are what determine the levels of risk in equities.
These are solid reasons for our continuing caution regarding equity speculation, and we must use our knowledge and instincts at this point, as well as our reliable metrics and indicators, as sensible guides. Where can we expect the S&P500 to go? Euphoria continues to “overwrite” sensible market behavior, but the continuation of extreme equity index overvaluations must crack at some point. Those cracks often require a significant external event to catalyze a protracted breakdown of equity overpricing.
This is still a good time to ignore any of the optimistic “happy talk” pumping of equities that still prevails, dismissing it as self-serving stimulation of churn in the accounts of less astute buyers. Only those with the highest tolerances for risk, and a long-horizon time-tolerance for protracted returns to break-even, should even think about speculating heavily in the equities markets at this point. These moves into “new highs” territory simply mean deeper into the bubble we have been talking about and illustrating since 2021. The last time the S&P500 was rationally priced, with risk levels still elevated at around 70%, was back in mid-2015 to mid-2016!
It would be sensible to remain conservatively invested, and resist the urge to join the current euphoria. It would be safer to slowly meter your cash back into riskier investments gradually. If you are currently heavily invested, taking some profits at these elevated levels would be more prudent than going “all in”. Over the past year and a half, if you have developed a list of portfolio elements you wanted to acquire when the Fed program was at its pivot point, now is the time to check that list again. Consider easing your way back into risk assets, at a rate of a few percent per month, paying closer attention to making those acquisitions at sensible prices, not at the trading tops of euphoric swings. We expect much higher volatility to come into play now that the lid is coming off of the cash stockpiles that have been sitting on the sidelines. We have to now assume more emotional and irrational responses will prevail until “something goes wrong”.
In 2022 and early 2023, the Fed had to ratchet up their projections for the amplitude and duration of their interest rate hike program EVERY single quarter since the end of 2021, until their mid-December 2023 FOMC projections. That was the first legitimate sign of a rate peak in this cycle. Since then, they first TWICE developed a more conservative consensus about the level and duration of “higher for longer”, without any cut in rates for the past year. Now, with September’s 0.5% rate cut, they return to optimism, with a more rapid return to a normalized rate picture.
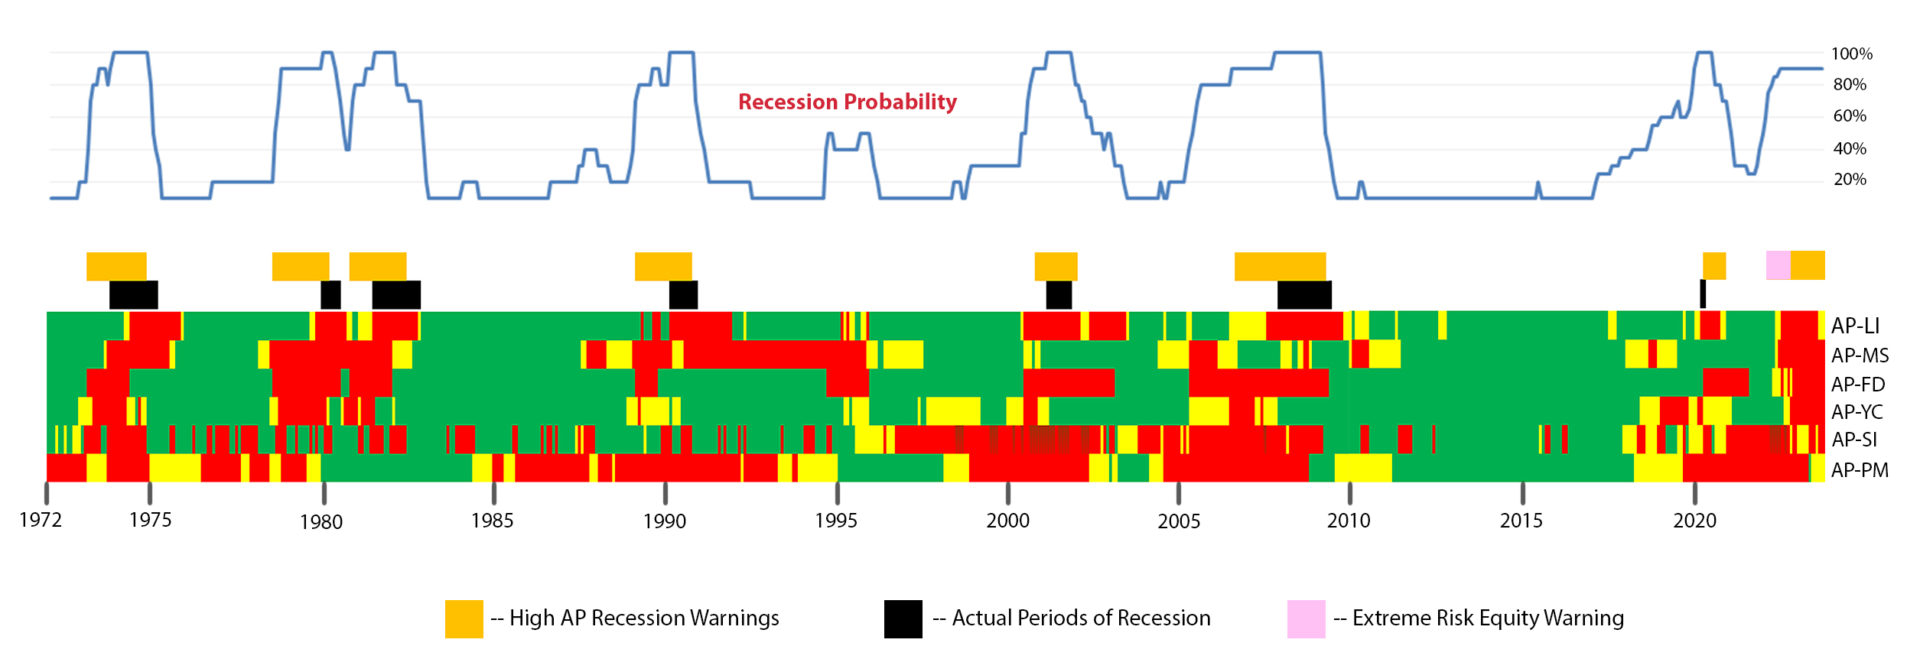
Real-time analysis here is not an exact science, but to be able to determine the start and finish of a recession or slowdown within a few months should give you an advantage in planning your business and investment tactics and strategies. Note that at the “end”, recession probabilities won’t fall off a cliff, but will instead gradually decline as each of the six indicators returns to a green state. Leading Indicators should turn around first, for a few months, and then other indicators should gradually turn down from their present red states. Historically, when the Fed begins to earnestly cut rates, that has correlated closely with the actual onset of a recession, as clearly illustrated in the now familiar chart below: